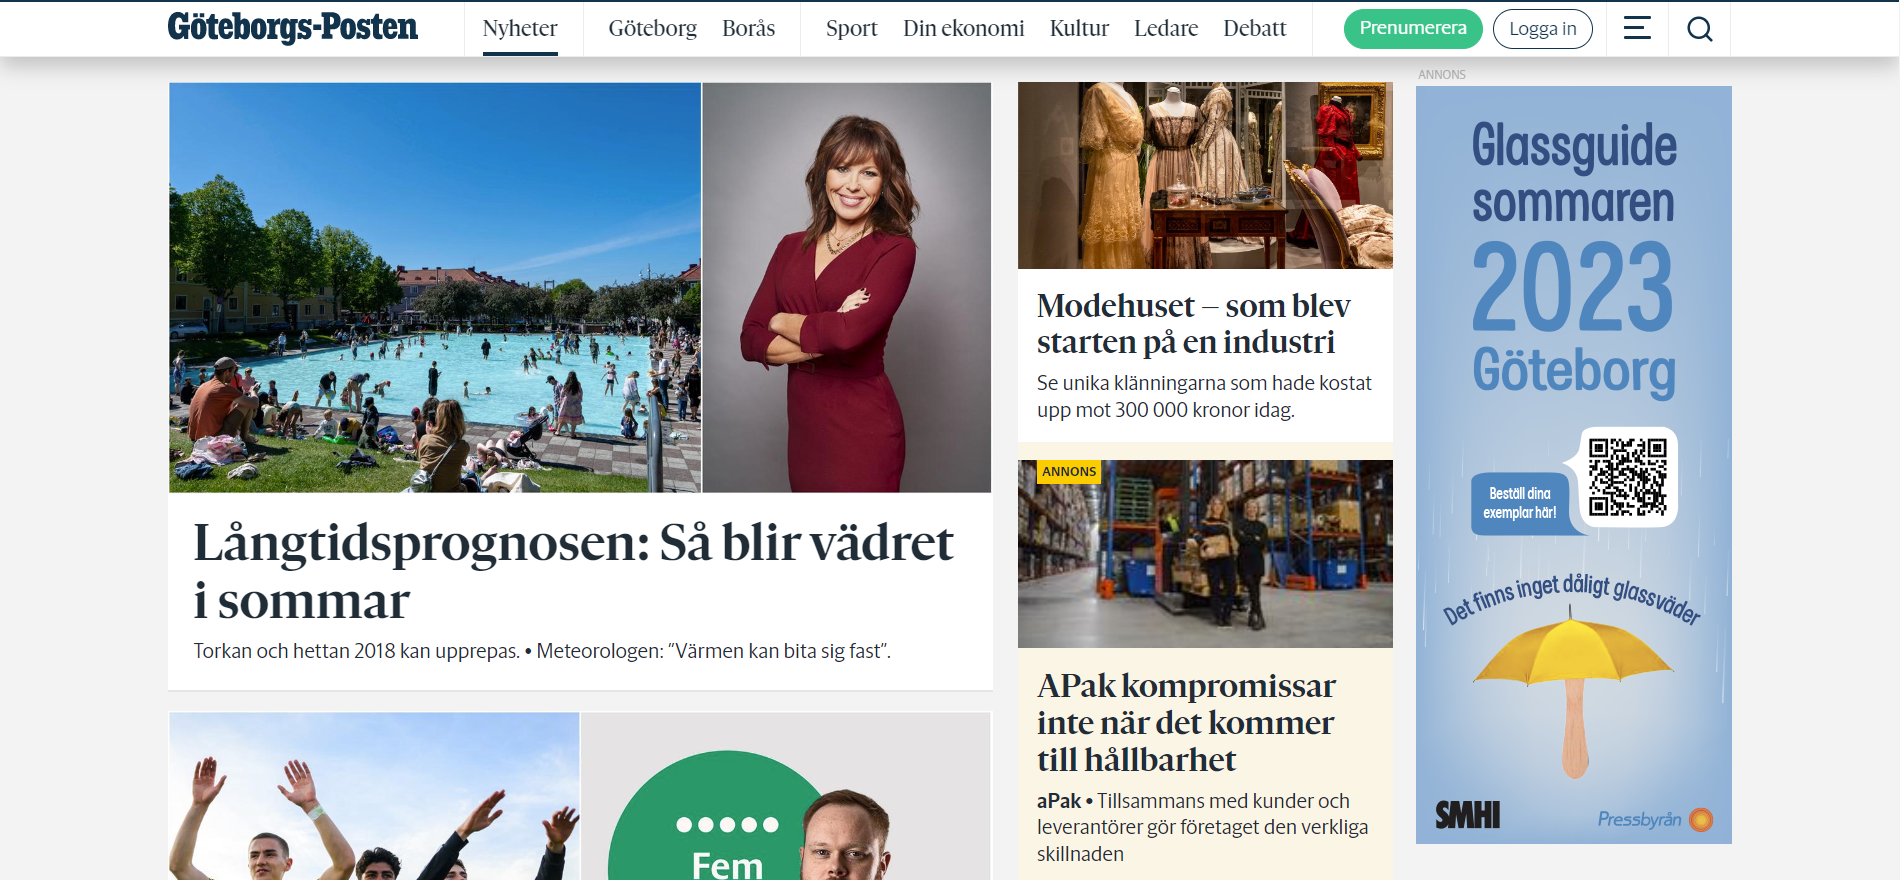
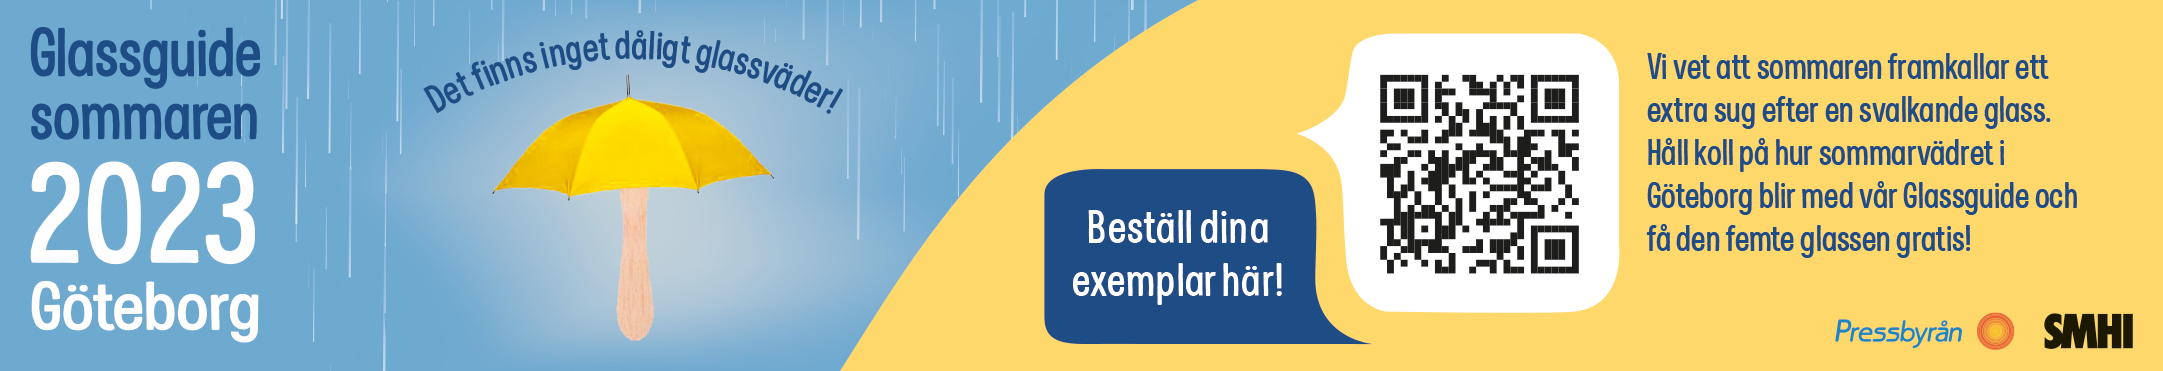
Background: This was a school assignment where we focused on learning how to make diagrams using Excel, Illustrator and SMHI's weather statistics of Gothenburg's weather from previous years. Brief: Create some type of folder with the theme weather, you can combine it with another theme if you want. Include at least two diagrams with relevant statistics based on the direction you decide to go. Create matching ads for Göteborgs Posten (GP) online and in print with a QR-code to a Google Form where you can order the folders.
Software: Photoshop, Excel, InDesign, Illustrator Credits: Pressbyrån, SMHI, SIA Glass, Göteborgs Posten
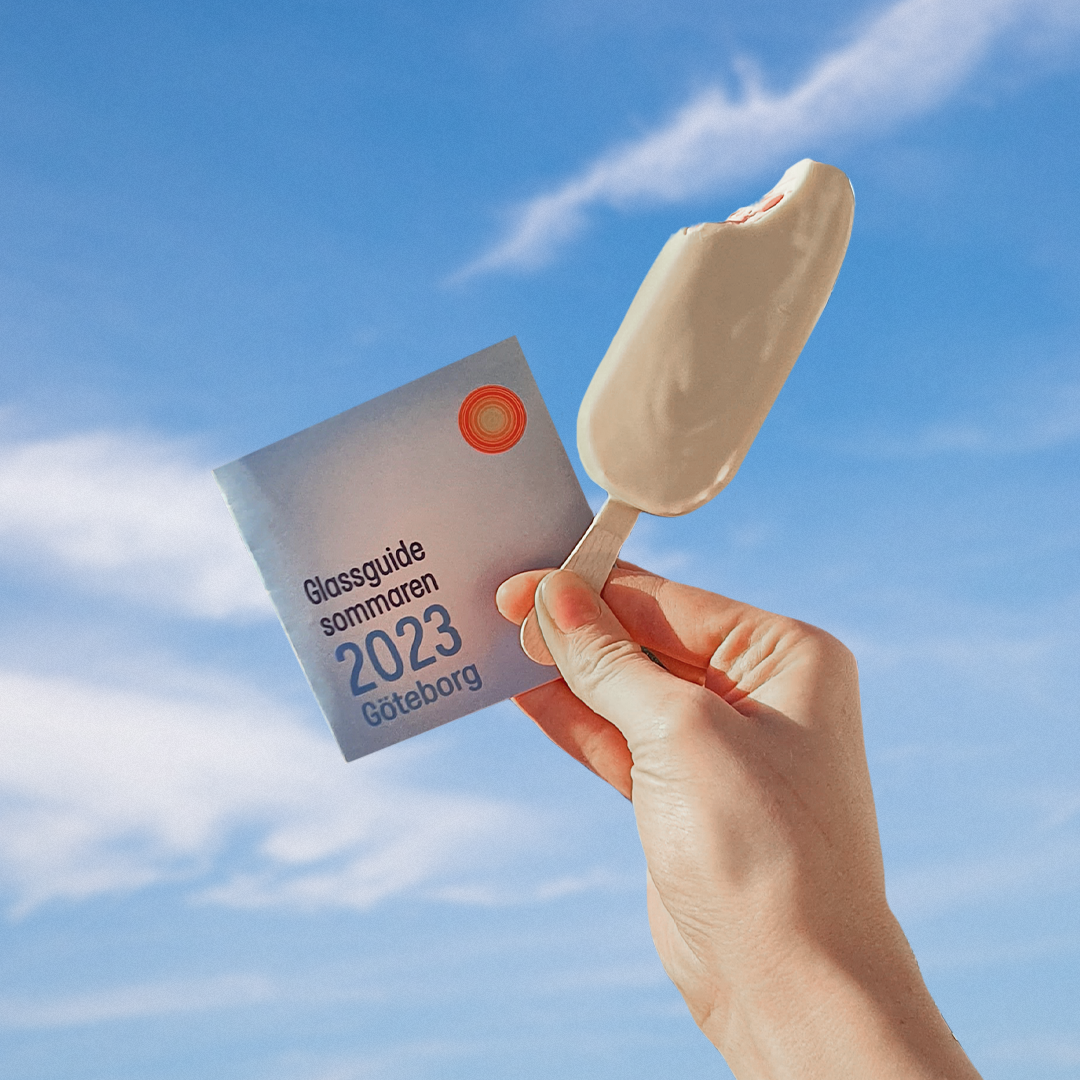
Summer = Ice Cream
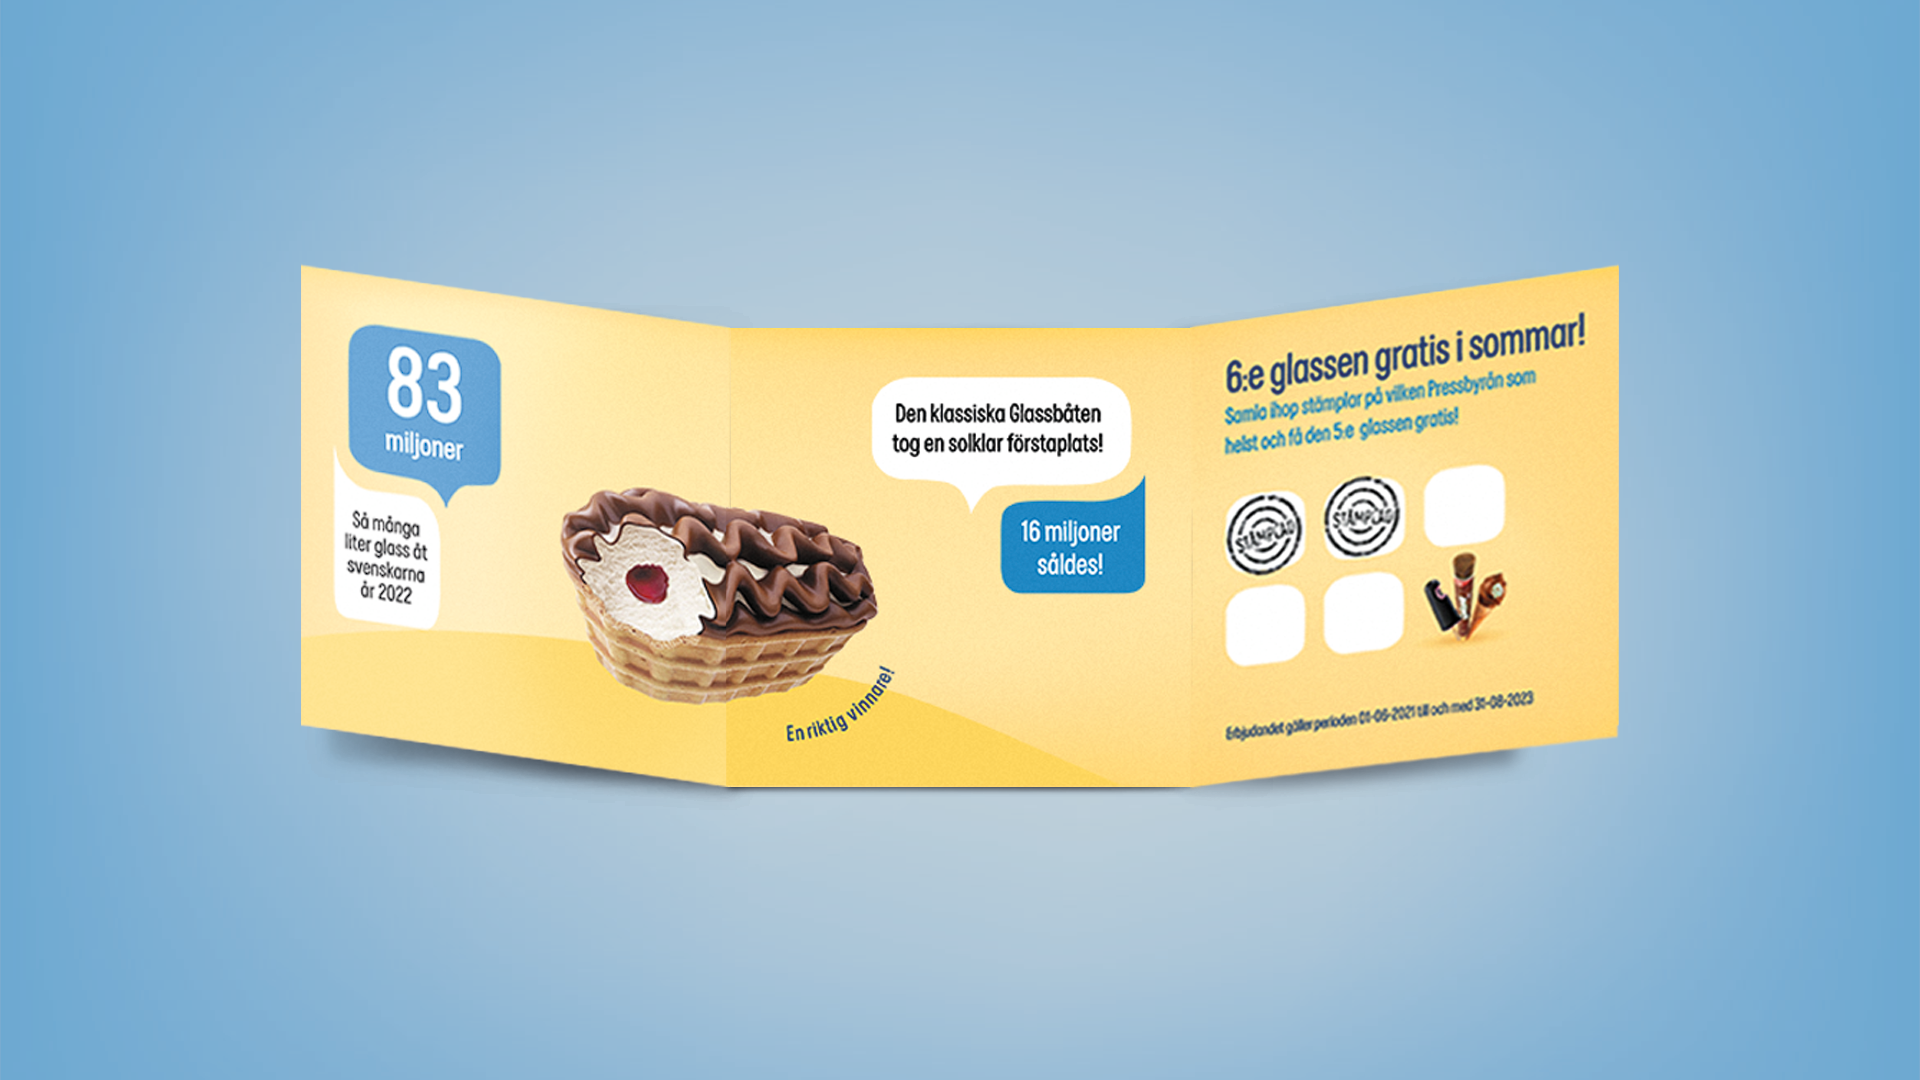
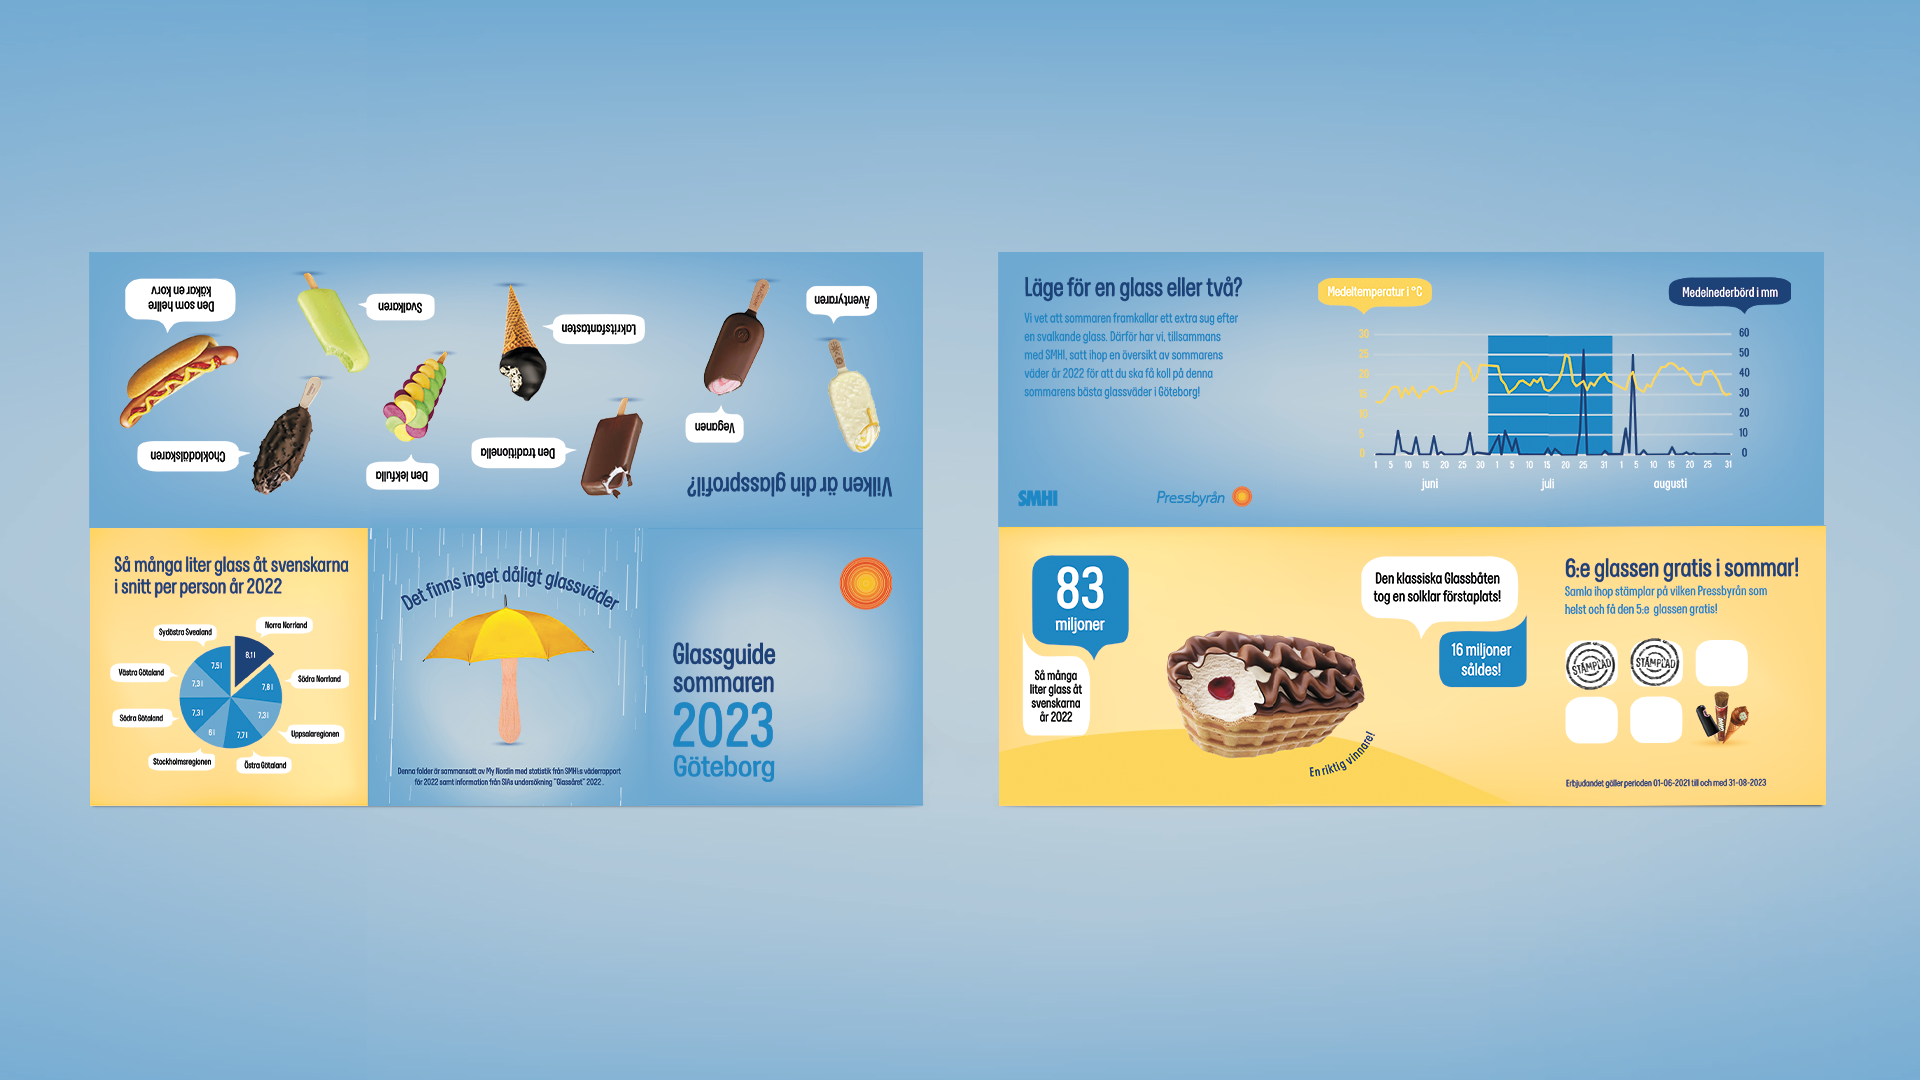
I decided to create my folder using Pressbyråns graphic profile (The one they've had for years until a week after I finished this project...) I used their playful tone and made the folder into an ice cream campaign (based of weather of course). I looked up some of their previous campaigns for inspiration, found their font "Press", picked out some of their colors and I was good to go!
The Diagrams
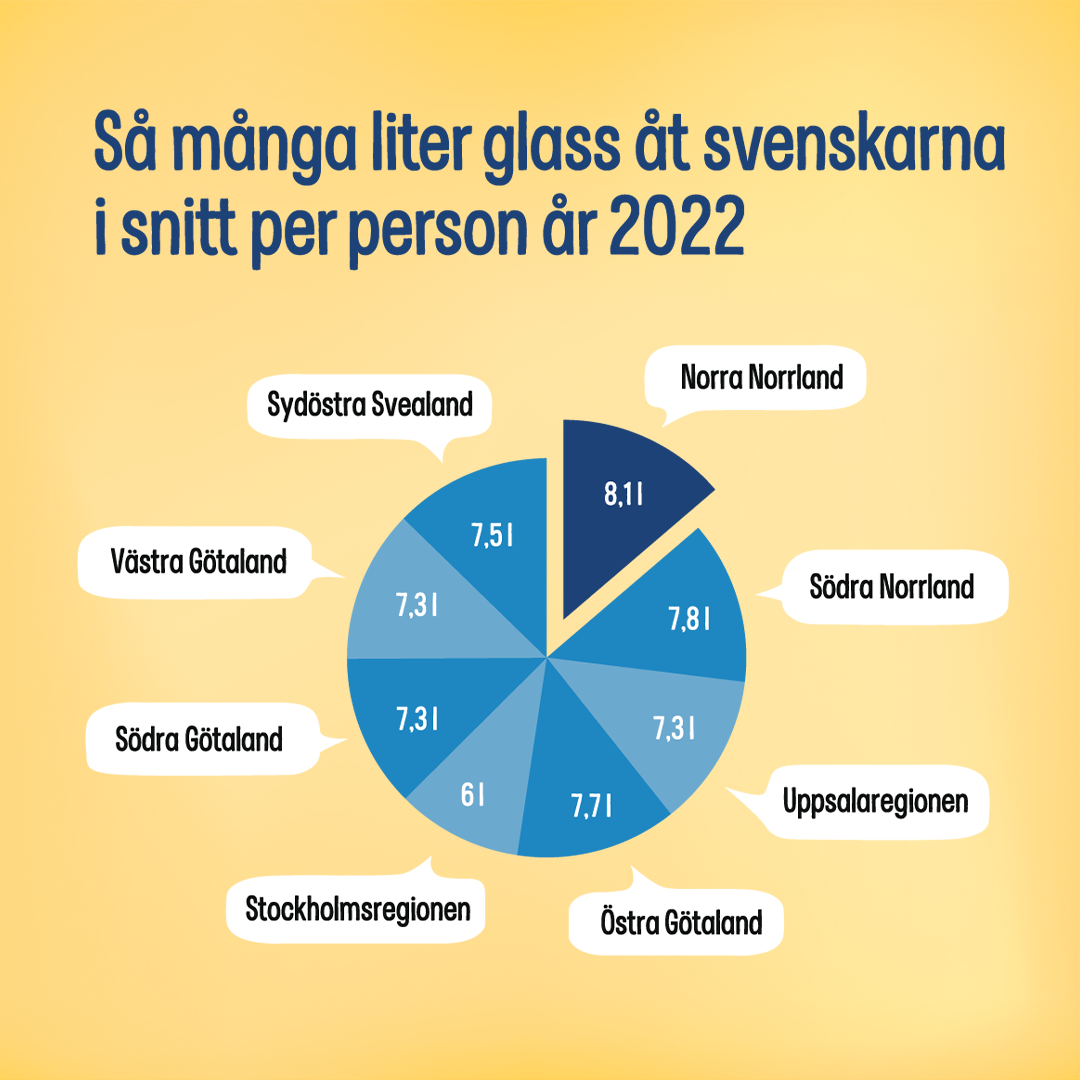
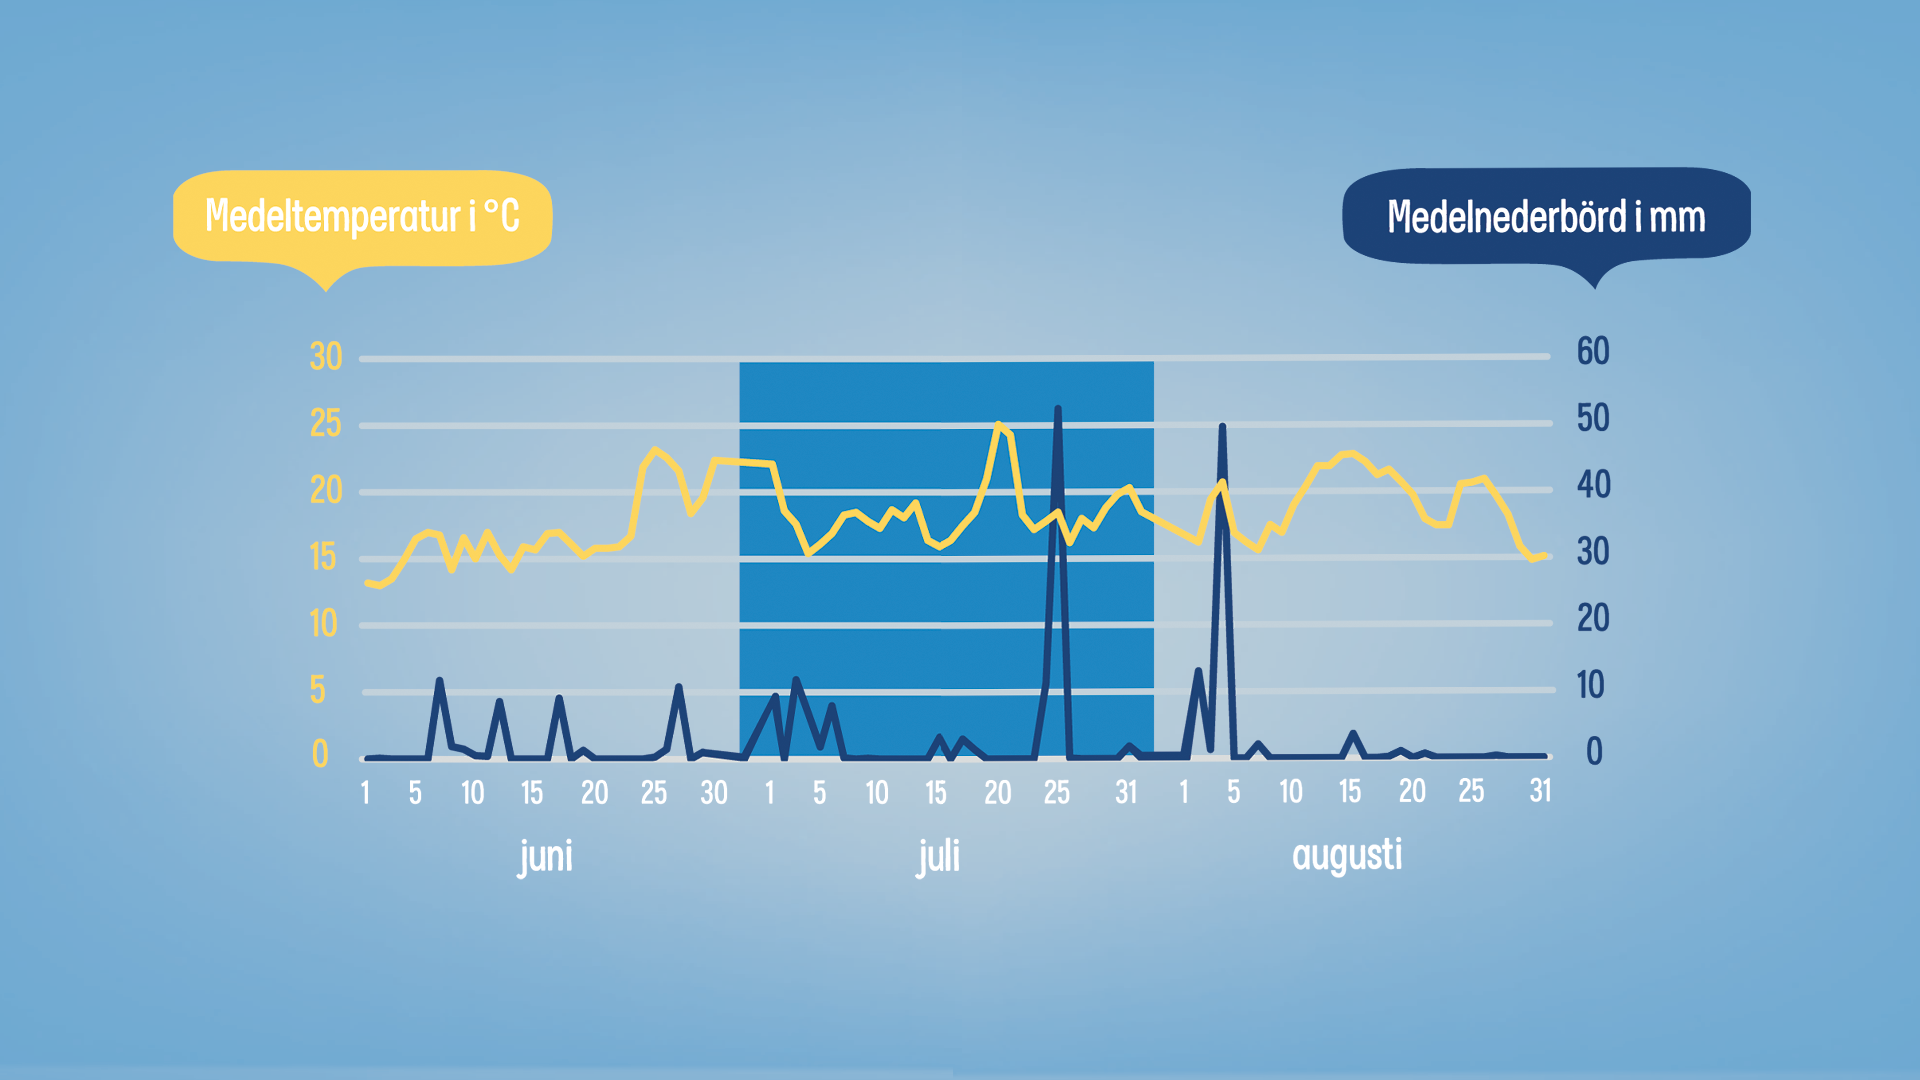
Since the assignment was to include two different diagrams, I chose to include the statistics from SIA Glass' survey "Glassåret 2022" to find out how much ice cream Swedes actually eat, and where they consume it the most, presented in a circle diagram. For the weather aspect, I used statistics from the three summer months of 2022 to create a combination chart showing the average rainfall and temperature.
The Print File
The Ads
This is a fictive case